Game Design Ideas GIS in Civil Engineering Cartographic Principles & Design
A complete lecture on designing GIS Maps and scaling etc.
Colour Text: Code: public class
Contents
Introduction: Cartographic Principles
Cartography is the art and science of map making. Cartographers make a huge contribution in making the maps more meaningful and understandable. In this chapter major principles of cartography are introduced.
Data Classification
It is important to have a good understanding of the data which needs to be represented on a map. One must recognize the scale of measurement for a particular data set because the scales determine the kind of mathematical operations that can be performed on the data. These scales of measurement are described below:
Nominal Scale
It only satisfies the identity property. The values assigned to variables are descriptive; they cannot be used for mathematical comparisons. For example, on the basis of gender we can classify individuals into ‘male’ and ‘female’ but neither of the gender is higher or smaller than the other.
Ordinal Scale
This scale has the properties of both identity and magnitude but the interval between any two values is indeterminate. It generally uses the operators “greater than”, “equal to” or “less than” for ordering the observations. For example, the result of an athletic event declares the ranks secured by various athletes but the ranks themselves do not describe by what time a rank holder has finished the race with respect to the another athlete.
Interval Scale
This scale has the properties of identity, magnitude and equal intervals. The Fahrenheit scale for measuring temperature is made up of equal temperature units, so the difference between 10 and 20 degrees Fahrenheit is equal to the difference between 40 and 50 degrees Fahrenheit.
The use of interval scale tells whether one is greater or smaller than the other and it also quantifies the amount by which one is greater or smaller than the other. For example the temperature of a city recorded on the first day of a month is 15 degrees and on the second day is 20 degrees. So we can say that the temperature on the second day is higher than that on the first and the second day is 5 degrees hotter than the first day.
Ratio Scale
The ratio scale has the properties of identity, magnitude, equal interval and absolute zero. Having true zero allows for computing ratios. Weight is an example of ratio scale. Weights can be given ranks, units along the weight scale are equal to each other and weight has an absolute zero.
0 kg means there is no weight and 100 kg is said to be twice of 50 kg.
Map Layout
A map conveys geographical information and relationships. The result of any analysis in GIS is communicated using maps so as to help users/readers to better understand the geographical phenomenon. The map can only fulfill its purpose when it is presented in a proper manner. There are certain points which are to be kept in mind while designing a map:
a. Objective: It is necessary to pay attention to the question why and where will the map going to be used. One should be clear about whether the map is just sharing information, depicting result of an analysis or highlighting the key issues and relationships. One should also know whether the map is going to be displayed on a wall, in a book or in some other information resource.
b. Audience: A designer/cartographer must know who will be addressed through the maps. Maps must match the level/expectations of the audience. The level of design for a technical group and for general people ought to be different.
c. Balanced design: A map must be prepared using appropriate page size, color, patterns of shading, text, and scale. Everything on the map should be legible.
Designing the map layout
The process of map composition starts with preparing a layout for the map. Apart from the data, a map has certain other things that make map a package of effective and clear communication. These provide critical information to users and are known as map elements. A layout specifies the space and positions for different map elements such as neat lines, title, North arrow, scale bar, legend etc. Preparing an effective layout often requires experimentation with the available space.
- Insert Image Table
Figure 1: A map Layout
Every element in the layout has to be given a thought—whether it is important to include the respective element, does it require elaboration etc. The map elements that are generally found on a map are:
• Scale: Scale must be given in order to derive the actual size of an entity on the map or distance between two geographical entities on a map.
• Direction: True north is the direction of North Pole and it differs from the magnetic north. The magnetic north pole changes due to the changes in the geo-physical condition of the earth. Many maps indicate both the true and the magnetic north but the direction that is indicated on most of the maps is the true north.
• Legend: Legend lists all the symbols used in a map and describes what they depict.
• Title: A short suitable text that clearly defines the theme of the map.
- Insert Image Table
Figure 2: A map with its elements
Given below are a few other elements that are selectively used:
• Neatlines: These are lines used to frame a map to indicate where the map begins and where it ends.
• Reference grid/Graticule: A reference grid is a network of evenly spaced horizontal and vertical lines used to create context on a map. The grid can be used to show unique locations (control points) either in a geographic coordinate system or in a projected coordinate system.
• Locator map: The maps that display locations unfamiliar to users, are generally supported with locator maps which represent the locations in a larger geographic context and with which the user is expected to be familiar.
• Inset map: Sometimes the details on a part of a map are so clustered that they become difficult to read and a magnified view of that part of the map is required. These magnified view maps or close up maps are called insets.
• Source of information: The age, accuracy and reliability of the data sources are critical in carrying out any study. One can show the sources of data one has used in maps so that a user can track them and check his analysis and interpretation.
• Date of production: The representation of time on the maps is important in some cases. For example the weather map prepared on daily, weekly or monthly basis must indicate time on them. A road map to be used for a developing city must be a recent one so as to be relevant for the city etc.
- A
Map Designing
A
- A
Data Representation
A
- A
Toposheet Indexing
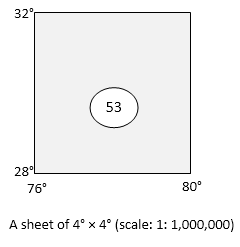
Survey of India produces the topographic maps of India. These maps are produced at different scales. In order to identify a map of a particular area, a numbering system has been adopted by the Survey of India.
For the purpose of an international series (within 4° N to 40° N Latitude and 44° E to 124° E Longitude) at the scale of 1: 1,000,000 is considered as a base map. This map is divided into sections of 4° latitude × 4° longitude and designated from 1 to 136 consisting of the segments that cover only land area.
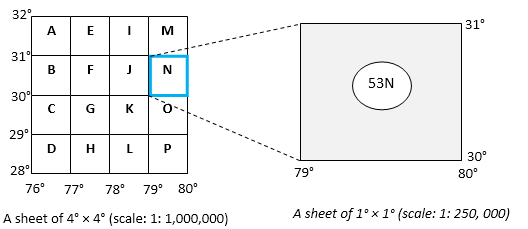
Each section is further divided into 16 sections (4 rows and 4 columns) each of 1° latitude × 1° longitude. The sections start from Northwest direction, run column wise and end in Southeast direction.
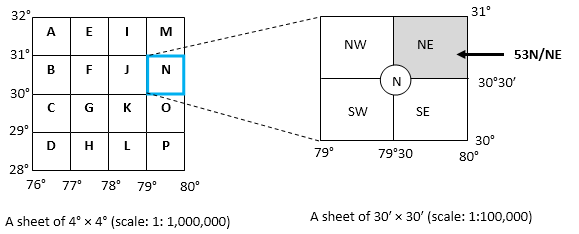
The 1°×1° sheets are further subdivided into four parts, each of 30′ latitude × 30′ longitude. These are identified by the cardinal directions NE, NW, SE and SW.
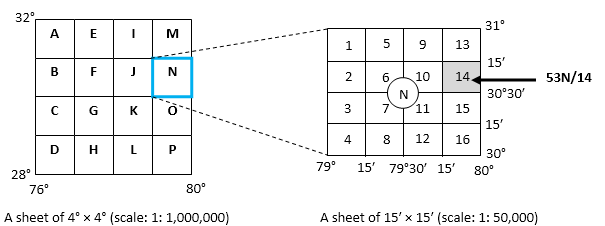
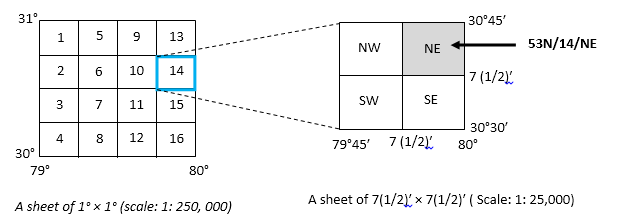
The 1°×1° sheets can also be divided into 16 sections each of 15′ latitude × 15′ longitude and are numbered from 1 to 16 in a columned manner.
A 15′×15′ sheet can be divided into 4 sheets, each of 7(1/2)′ and are numbered as NW, NE, SW and SE
The classification of maps has already been discussed in unit 1, given below is a brief account of distribution maps.
Distribution Map
A
- A
Lab Exercise: Cartographic Principles & Design
A
- A
A
A
- A